Tutorial — Troubleshooting a failed deployment
Edit on GitHubA deployment fails, and there are no errors in the deploy or build output. Based on the step the deployment fails at, do the following:
Deployment fails at the Build_Push_if_not_exist step
If a deployment fails at the Build_Push_if_not_exist, do the following.
1. Check deploy logs
Check the build logs via Log groups as follows. Filter the log groups by codebuild.
-
In the AWS Management Console, go to Services > CloudWatch > Log groups.
-
In the Log groups pane, filter log groups by entering a query in the search bar. For example, enter staging.

-
Select the desired log group.
-
In the Log streams pane, select the log stream according the last event. The last event time should match the time when the issue occurred.

- In the Log events pane, filter events by entering a query in the search bar.
2. Check deploy logs in multiple log groups at once
Check multiple log groups via Logs Insights as follows. Select the log groups containing codebuild.
- In the AWS Management Console, go to Services > CloudWatch.
- In the navigation pane, select Logs > Logs Insights.
- Select the desired log groups.

- Select the desired time period.
- Insert a search query into the query field. Use the following examples as a reference.
- Select Run query.
- Check the logs that appear in the pane below.
Example 1: search for 500 errors during the last 6 hours.

Example 2: search for build errors, excluding rds_backup, during the last 3 hours.

To learn more about the syntax of the queries, see CloudWatch Logs Insights query syntax. For more examples of queries, see Sample queries - Amazon CloudWatch Logs.
3. Check Build_Push_if_not_exist step execution details
- On the page of the deployment in the
Build_Push_if_not_existstep, select Details.
![execution_details]
-
In the Action execution failed window that opens, select Link to execution details.
-
On the page of the step execution, switch to the Phase details tab.
-
If one or more of the statuses is not Succeeded, check the reason in the Context column.
![phase_details]
Deployment fails at the Run_pre-deploy_hook step
1. Check step execution logs
- On the page of the deployment in the
Run_pre-deploy_hookstep, select Details.
![execution_details]
-
In the Action execution failed window that opens, select Link to execution details.
-
In Build logs, check the
PRE_BUILD State. -
If the state is
FAILED, go back to the pipeline and rerun the step by selecting Retry.
![retry_run_pre-deploy_hook]
- If the step fails, recheck the
PRE_BUILD Stateby following steps 1 to 3. If the state isFAILED, follow the steps in the later section.
2. Check the script of the step
To locate the deploy file in which the script is located and check its commands, do the following:
- In the Build logs, check the value of the
SPRYKER_HOOK_BEFORE_DEPLOYvariable.
![SPRYKER_HOOK_BEFORE_DEPLOY_variable]
In this example, the value vendor/bin/install -r EU/pre-deploy -vvv means that the script of the build step is located in config/install/EU/pre-deploy.yml.
If the variable isn’t set, the default script is executed:
vendor/bin/install -r pre-deploy -vvv
This default scripts are located in config/install/. This particular one is located in config/install/pre-deploy.yml.
Alternatively, you can check the script of the step in the environment’s deploy file.
- In the deploy file you’ve located in step 1, check the commands of the script.
![pre-deploy-file]
In this example, the scheduler:suspendddddddddddd is misspelled, and it is the root cause of the issue.
As most of the issues at this step are related to its script, we recommend adding debug commands to them.
Deployment fails at the Deploy_Spryker_services step
If a deployment fails at the Deploy_Spryker_services, check the ECS services that failed to deploy and their tasks as follows:
- In the AWS Management Console, go to Services > Elastic Container Service.
- In the navigation pane, select Clusters.
- Select the cluster of the environment to which an unavailable service belongs.
- On the page of the cluster, select the unavailable service.
- On the page of the service, check if the Running count is equal to the Desired count. If the numbers are equal, the service is running correctly.
- Switch to the Tasks tab.
- Check if the Last status is Running.

- If the task is not running, switch to the Events tab and check the errors.

- Switch to the Tasks tab.
- For the Desired task status, select Stopped.
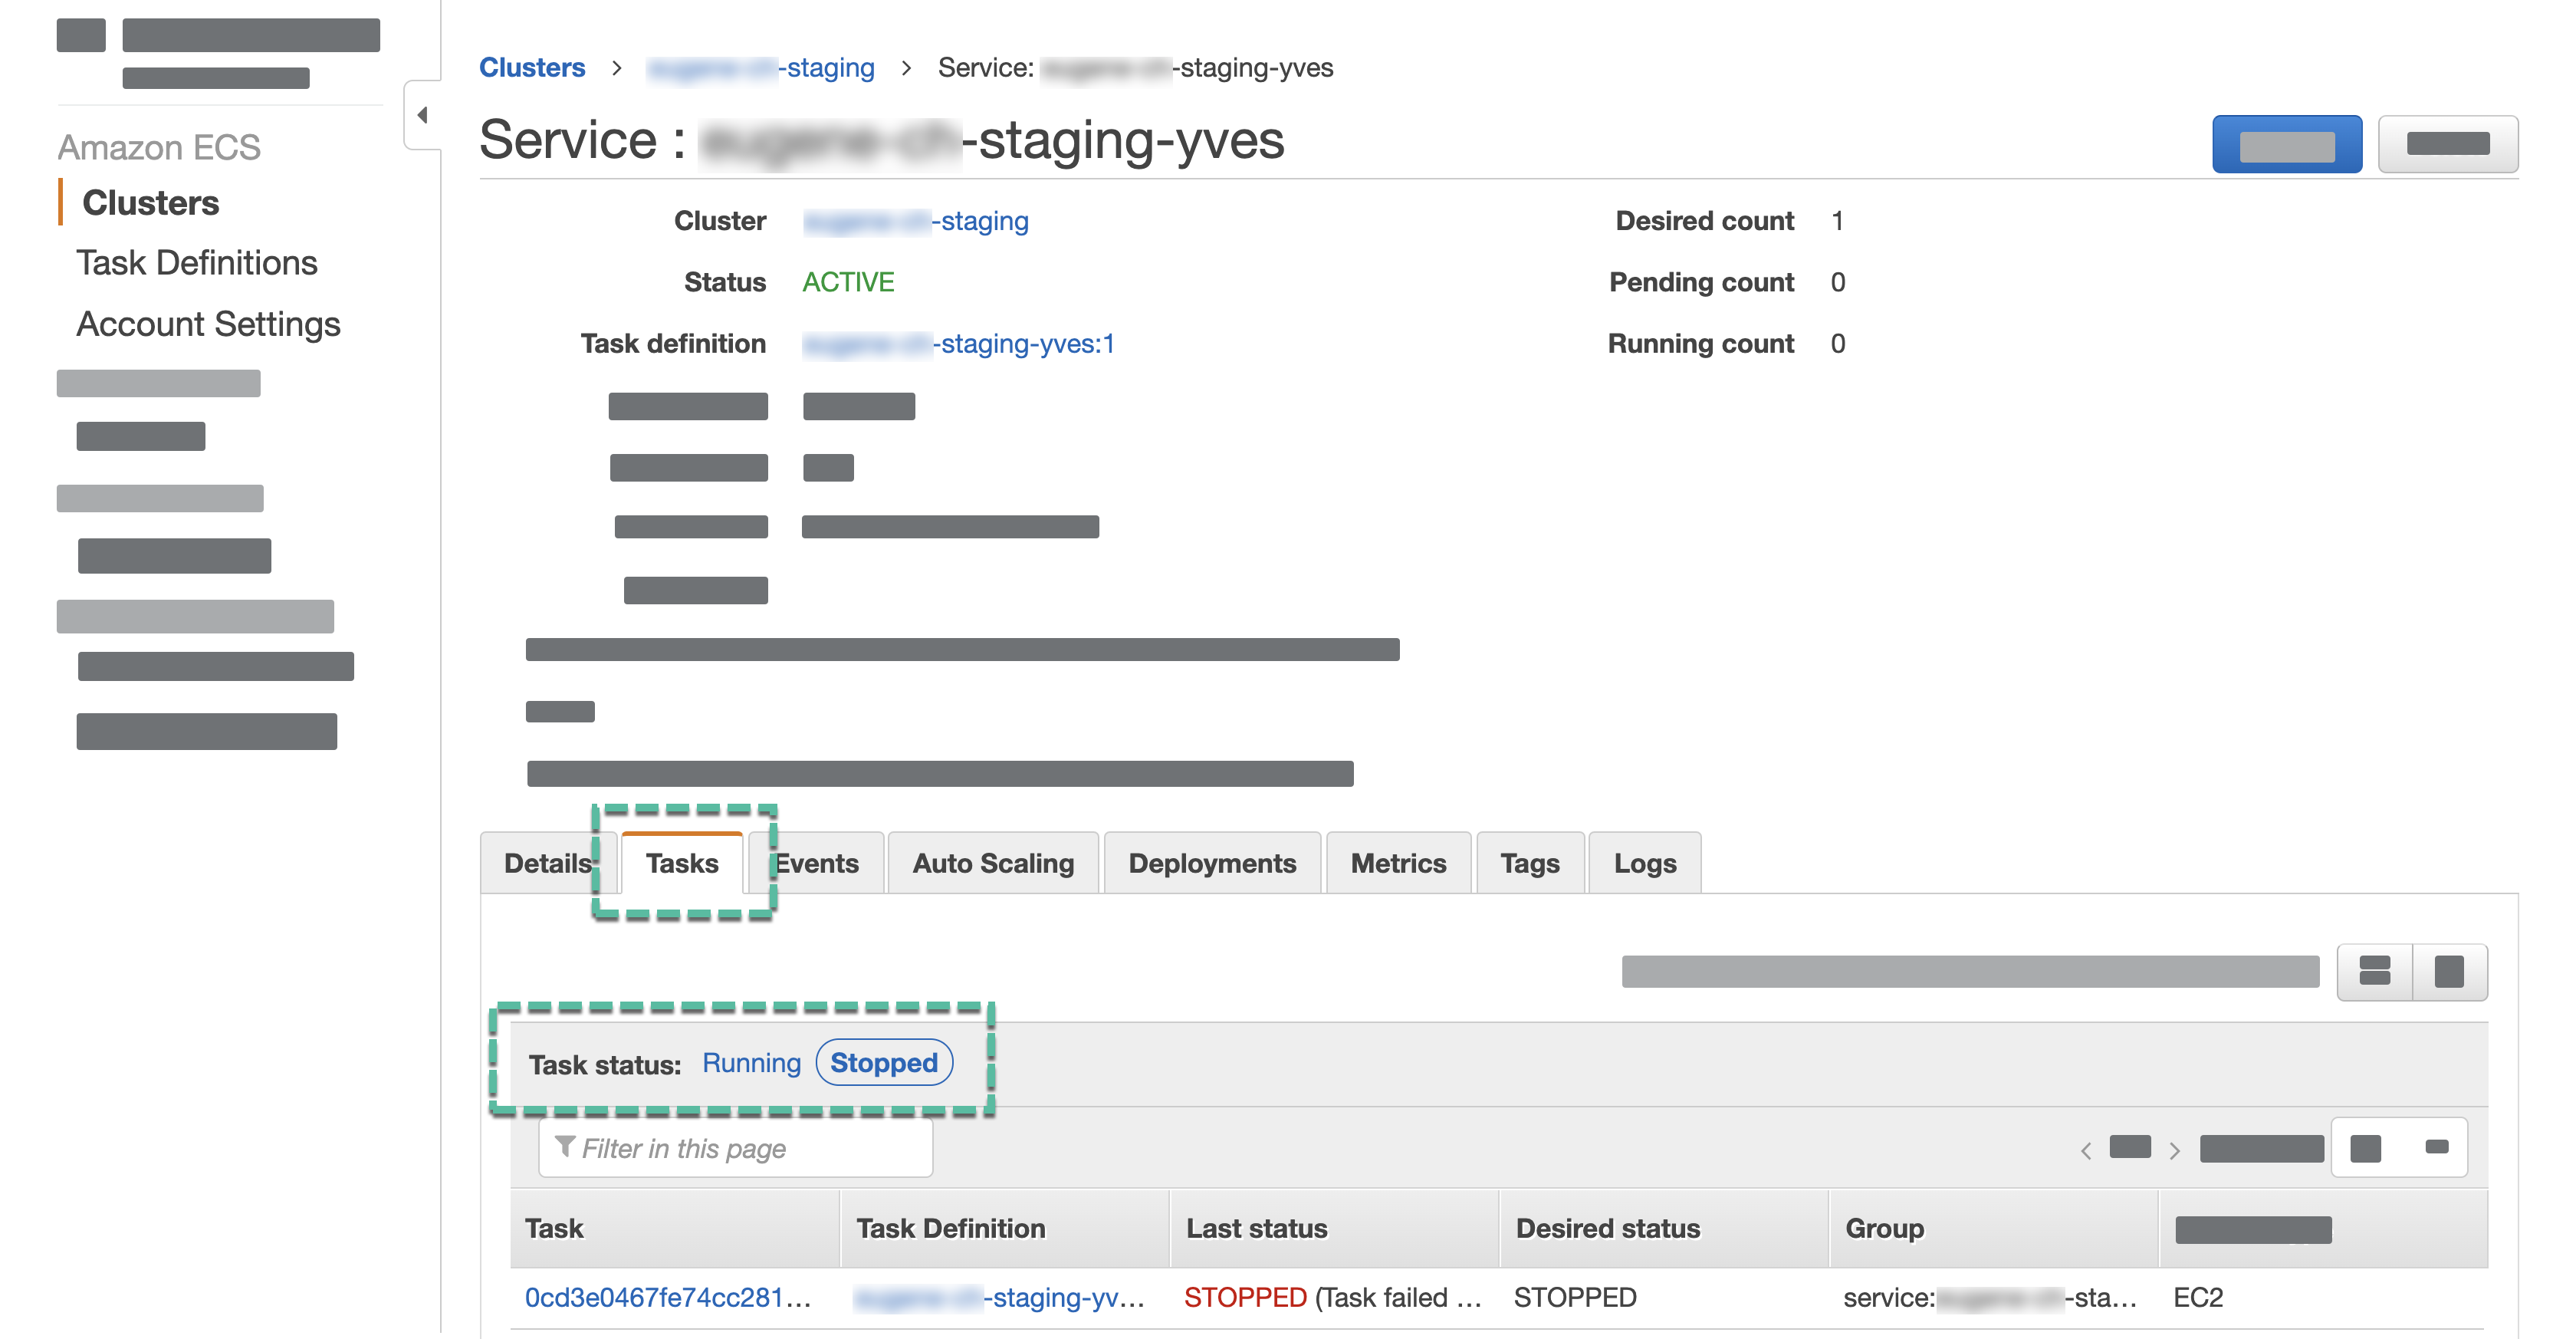
- Select the latest stopped task.
If there are multiple stopped tasks, to identify the latest one, open the page of every task and compare the Stopped at dates and times.
-
In the Containers section, select the arrow before the container name.
-
In the Details section, check the exit code and the errors.

Deployment fails at the Deploy_Scheduler step
If a deployment fails at the Deploy_Scheduler, do the following.
1. Check Jenkins status
- In the AWS Management Console, go to Services > EC2.
- In the navigation pane, select Instances.
- Select the checkbox next to the Jenkins instance you want to check for issues. The Name format is
{ENVIRONMENT_NAME}-scheduler. - Next to the instance name, check Instance state and Status check.
- In the pane of the instance that has appeared below, switch to the Monitoring tab.
- Select the desired time period.
- Check the graphs for spikes. Consider 10 times the usual usage a spike.

Depending on your screen size, you may have to scroll down to see all the graphs.
2. Check Jenkins system information
- In the AWS Management Console, go to Services > EC2.
- In the navigation pane, select Instances.
- Select the checkbox next to the Jenkins instance you want to check the system information of.
- In the pane of the instance that has appeared below, copy Private IPv4 addresses.

- Using the IP address you’ve copied, open the Jenkins Web UI at
https://{PRIVATE_IPV4_ADDRESS}/script. - On the Script Console page, insert the following script and select Run.
def dh = "df -h".execute()
def la = "w".execute()
def vmstat = "vmstat -S M".execute()
def mpstat = "mpstat -P ALL".execute()

println "------- dh -------"
println dh.text
println "------- la -------\n"
println la.text
println "------- vmstat -------\n"
println vmstat.text
println "------- mpstat -------\n"
println mpstat.text
Output example:

3. Check Jenkins deploy logs
Check Jenkins deploy logs via Log groups as follows. Filter the log groups by jenkins.
-
In the AWS Management Console, go to Services > CloudWatch > Log groups.
-
In the Log groups pane, filter log groups by entering a query in the search bar. For example, enter staging.
-
Select the desired log group.
-
In the Log streams pane, select the log stream according the last event. The last event time should match the time when the issue occurred.
- In the Log events pane, filter events by entering a query in the search bar.
Thank you!
For submitting the form